
Chapter 76: Formatting Graphical Objects
Chapter Description
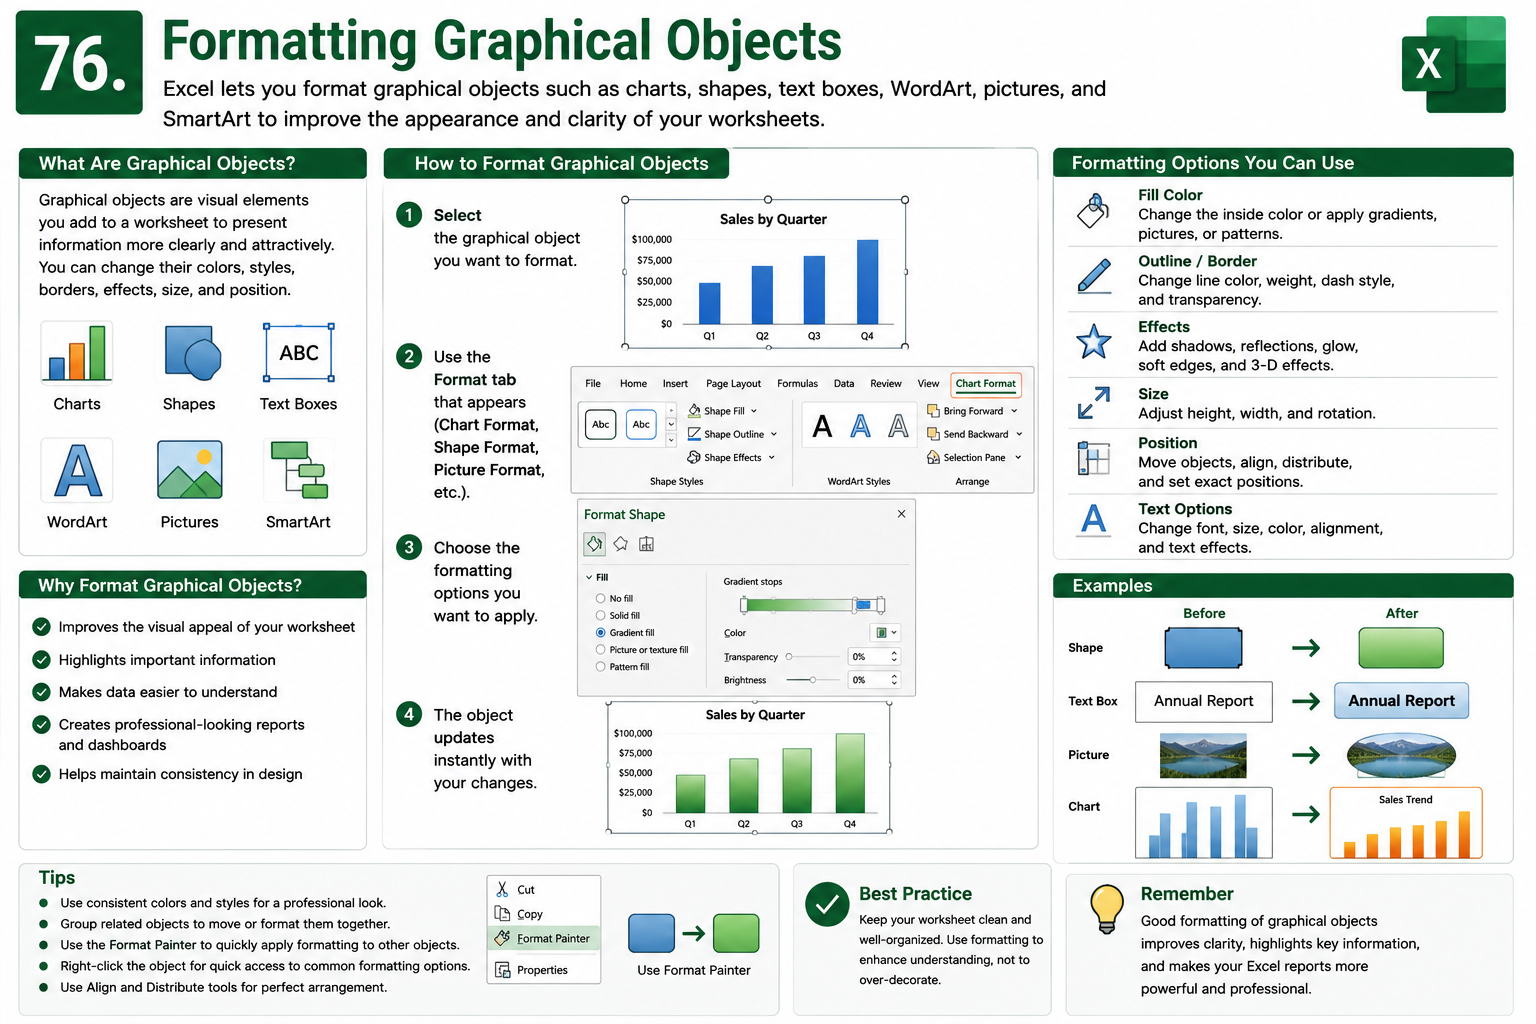
In this chapter, you’ll learn how to format graphical objects in Microsoft Excel to create visually appealing and professional worksheets. Excel allows you to customize charts, shapes, pictures, icons, SmartArt, WordArt, and text boxes by applying different colors, styles, borders, effects, and layouts.
You’ll explore the formatting tools available in Excel and discover how to enhance the appearance of graphical elements while improving the readability and presentation of your spreadsheets.
This lesson is especially useful for creating dashboards, reports, presentations, business documents, and data visualizations that communicate information clearly and effectively.
What You’ll Learn
- Understanding graphical objects in Microsoft Excel
- Formatting shapes, pictures, and icons
- Customizing charts and chart elements
- Editing WordArt and text boxes
- Applying fill colors, outlines, and borders
- Adding shadows, reflections, and other visual effects
- Resizing, rotating, aligning, and arranging objects
- Using built-in styles and formatting options
- Best practices for creating professional Excel worksheets
Learning Outcome
By the end of this chapter, you’ll be able to confidently format graphical objects in Microsoft Excel to improve the appearance and functionality of your worksheets. You’ll create professional reports, dashboards, and presentations using customized charts, shapes, images, and other visual elements that enhance communication and make your data easier to understand.