

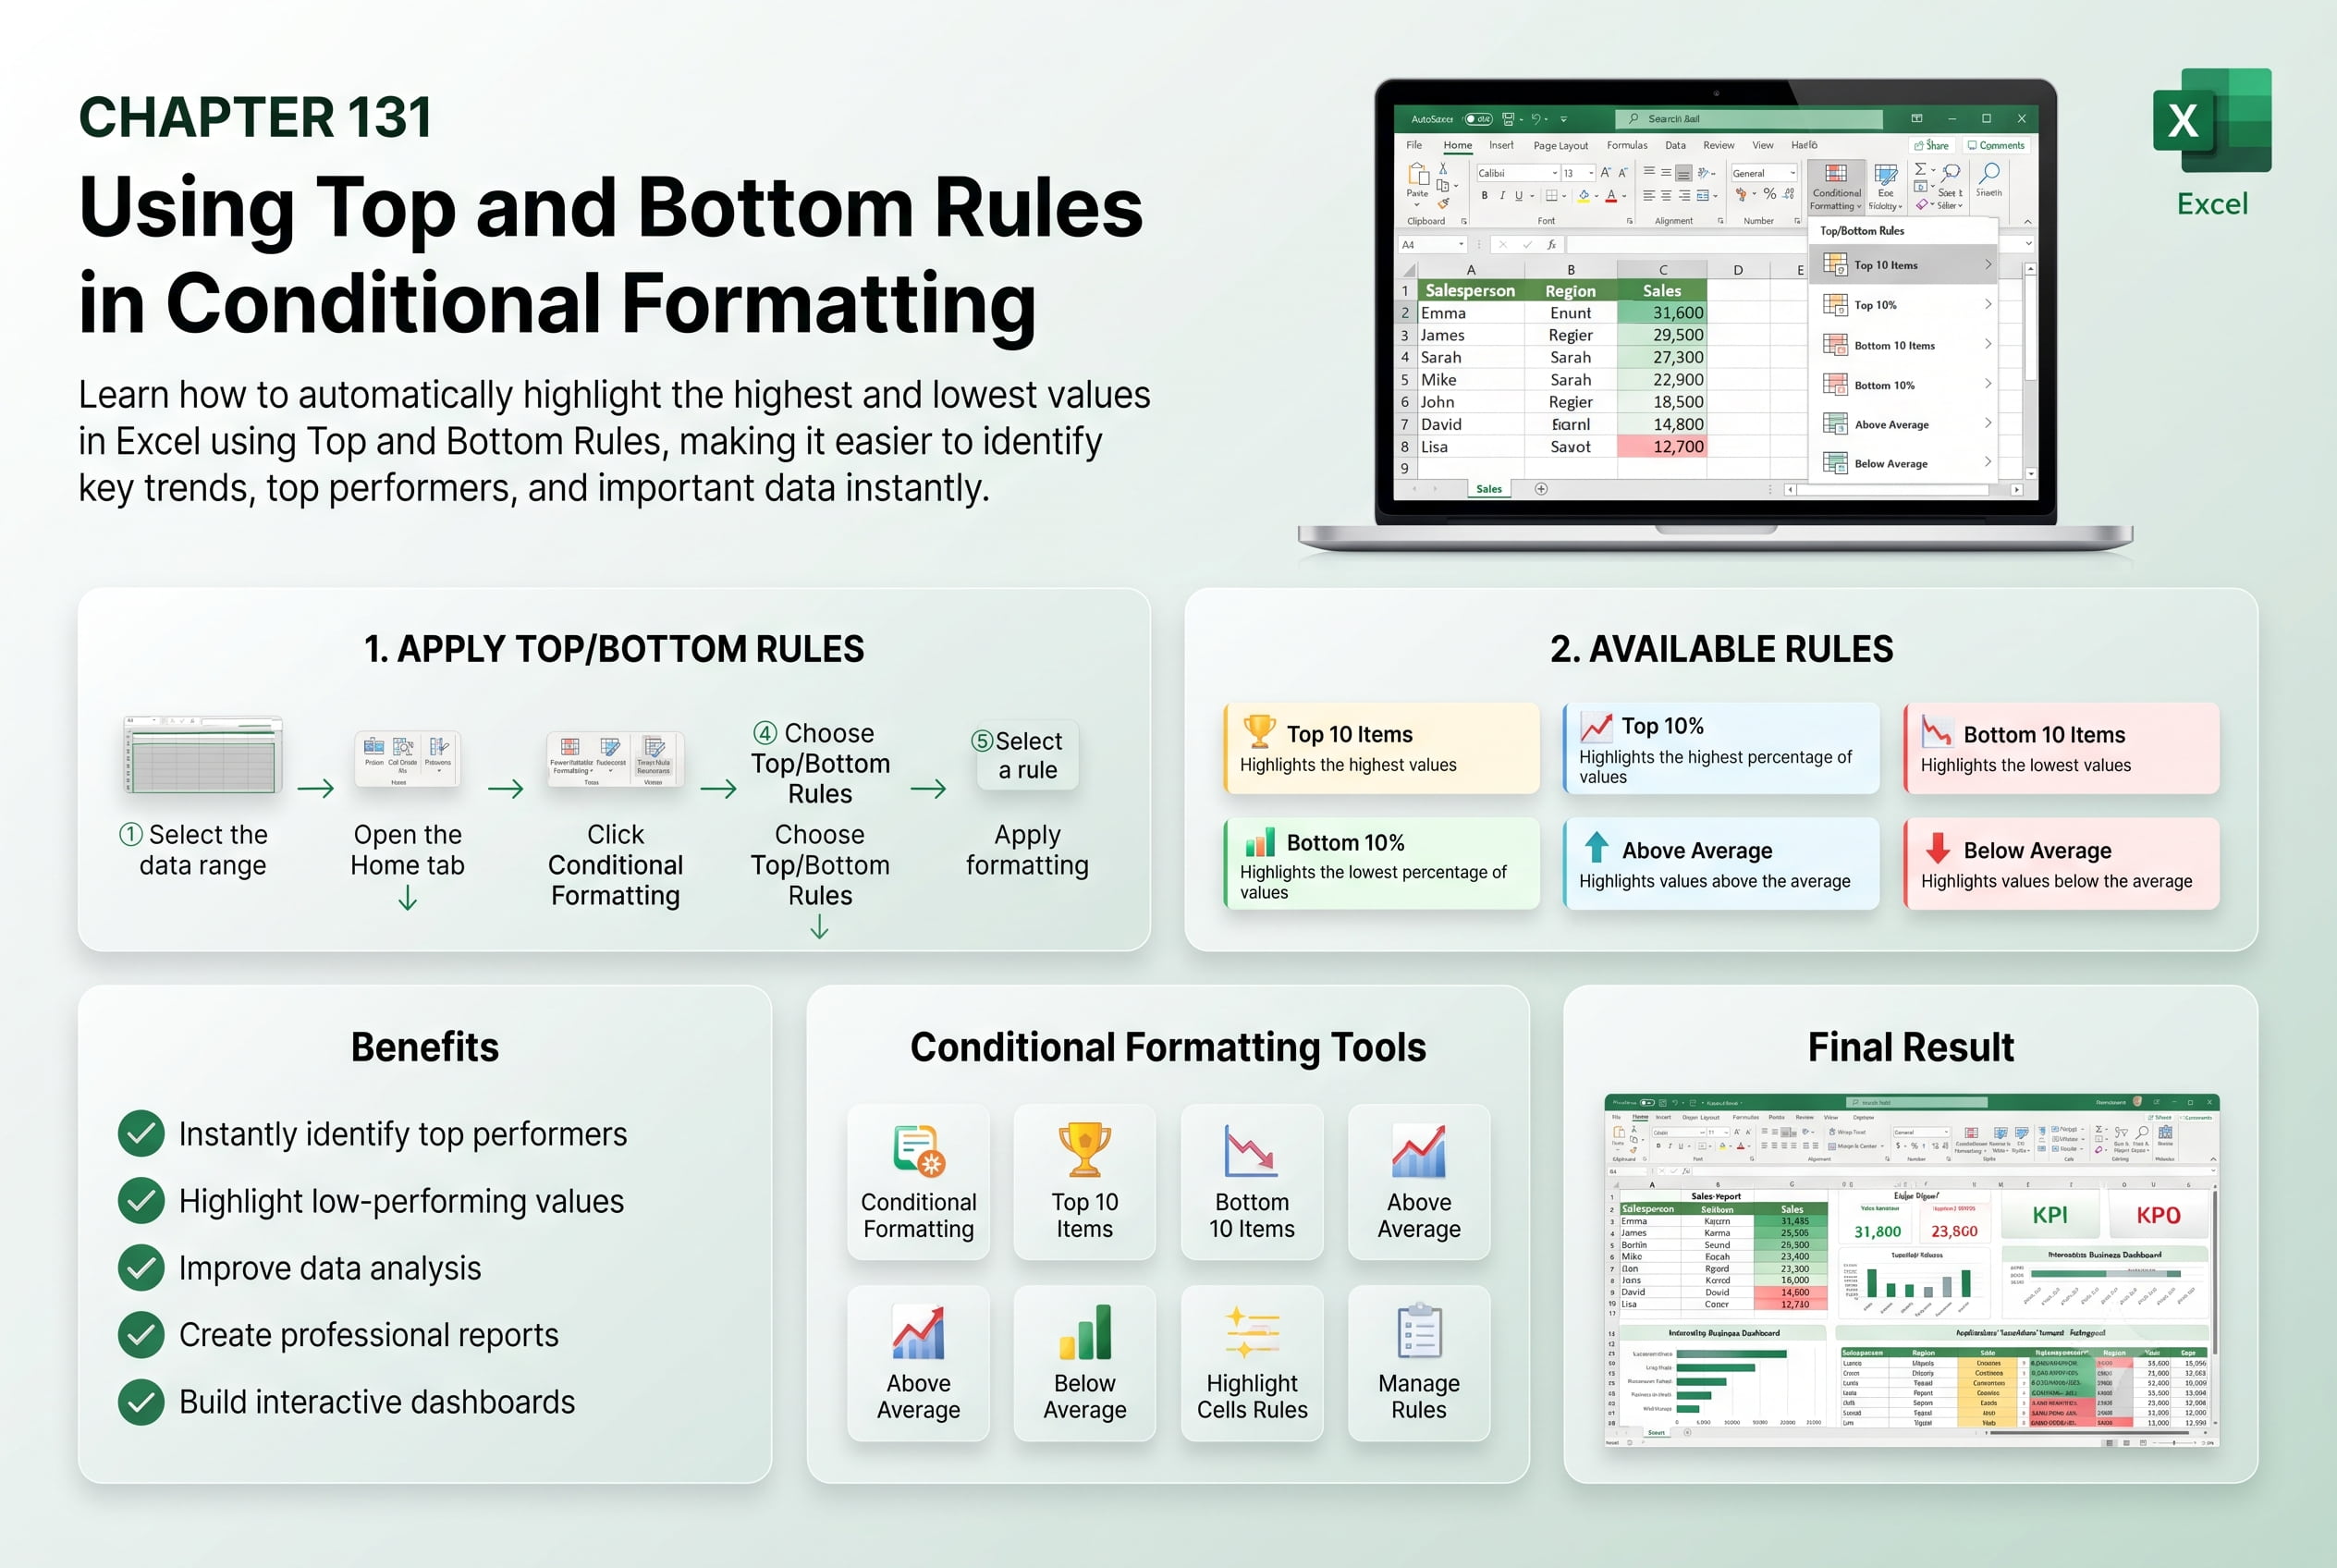
Chapter 131: Using Top and Bottom Rules in Conditional Formatting
Chapter Description
In this chapter, you’ll learn how to use Top and Bottom Rules in Excel’s Conditional Formatting to automatically highlight the highest and lowest values in your data. These rules help identify top performers, low-performing results, and important trends instantly.
You’ll explore different highlighting options and customize formatting to improve data analysis.
This lesson is especially useful for sales reports, exam results, financial analysis, inventory management, and performance dashboards.
What You’ll Learn
- Understanding Top and Bottom Rules
- Highlighting highest values
- Highlighting lowest values
- Customizing conditional formatting
- Identifying trends quickly
- Managing formatting rules
- Best practices for visual analysis
Learning Outcome
By the end of this chapter, you’ll be able to use Top and Bottom Rules to highlight important data automatically and make your worksheets more informative and visually effective.